The Dollar Broke 100 and Gold Broke $4,000: Decoding the Single Most Important Number in the Market Today
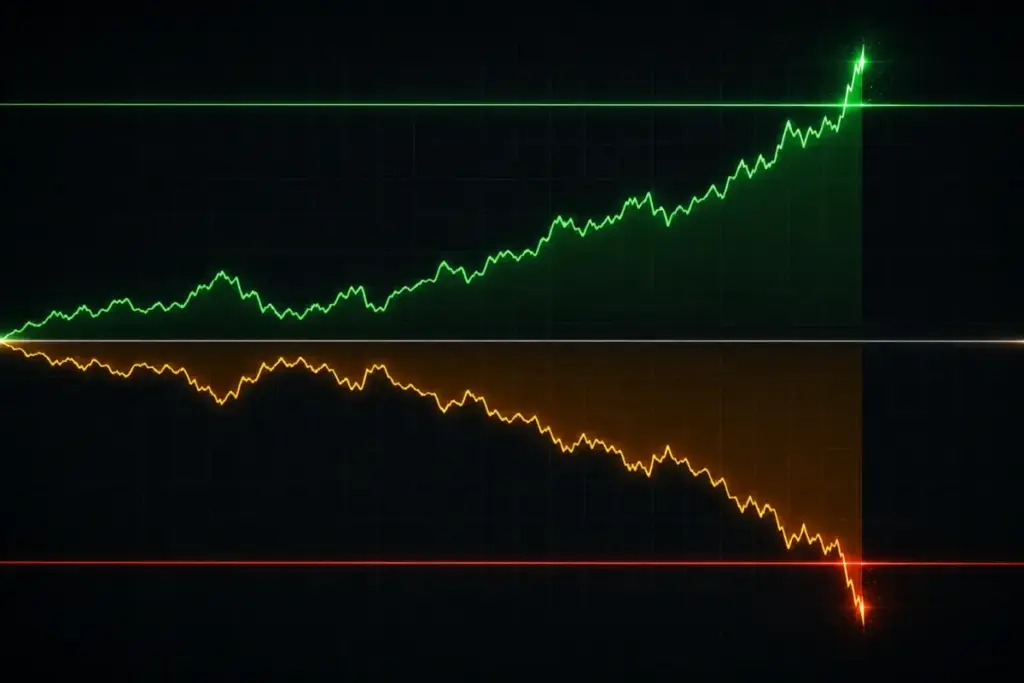
When two major price levels break on the same day, it is rarely a coincidence. This Wednesday June 24, the US dollar index broke above 100 — climbing to around 101.35, its highest since May 2025 — and at almost the same time, gold broke below $4,000, falling to roughly $3,988. These two moves are deeply connected, and understanding the relationship between them is the key to understanding everything happening in the gold market right now.
The relationship is mechanical and direct. Gold is priced in US dollars globally. When the dollar strengthens, it takes fewer dollars to buy the same amount of gold, so the dollar price of gold falls. When the dollar weakens, gold’s dollar price rises. This inverse relationship is one of the most reliable in all of finance. So when the dollar index broke above 100 today, gold breaking below $4,000 was almost its mirror image. The dollar’s strength is, quite literally, gold’s weakness in this moment.
But why did the dollar break 100? This is where the Federal Reserve comes in. The dollar strengthens when US interest rates are expected to rise, because higher rates attract global capital seeking yield. Following last week’s hawkish Fed meeting under new Chair Kevin Warsh, rate-hike expectations have surged. Markets now price a 68% chance of a September hike, up from just 29% a week ago. Bank of America expects three hikes this year totalling 75 basis points; Deutsche Bank expects two. This dramatic shift in rate expectations is what propelled the dollar above 100, which in turn pushed gold below $4,000. The chain runs: hawkish Fed leads to higher rate expectations, which lead to a stronger dollar, which leads to lower gold.
Two additional forces amplified today’s move. First, the easing of the Iran conflict — with the Strait of Hormuz reopening and oil down more than 4% — removed gold’s safe-haven premium. Second, a selloff in US tech stocks forced investors to sell gold to cover losses elsewhere, adding liquidation pressure right at the critical $4,000 level.
Now here is the crucial question the World Gold Council itself posed this week: is the dollar’s break above 100 a genuine structural “jailbreak,” or a “head fake” that sets the stage for a reversal? History leans toward the latter. Every sustained break above 100 since 2000 that came with elevated rate expectations ultimately mean-reverted — and each reversal created an extended period of above-average returns for gold. In other words, the very dollar strength crushing gold today has historically been the setup for gold’s strongest recoveries.
For buyers, the takeaway is clear. Gold at $3,988 reflects a moment of maximum dollar strength and maximum Fed hawkishness. Both are cyclical. This week’s US PCE inflation data on Thursday is the next test: if inflation shows signs of easing as oil falls, the aggressive rate bets could soften, the dollar could retreat from its highs, and gold could begin to recover. The structural floor remains firm — central banks turned net buyers again in April, and 45% plan to add reserves this year.
Today’s prices: 24K — $128.00/gram | 22K — $117.33/gram | 21K — $112.00/gram
All prices USD. Wednesday June 24 indicative. Confirm in store.